
HOME > Biota > Birds > BFS Bird Data on eBird
BFS Bird Data on eBird
Data from Prof. Cathy McFadden's monthly BFS bird surveys (2001-present) as well as other reported sightings by BFS researchers, students, and visitors are available on eBird, a public repository of bird records sponsored by the Cornell Lab of Ornithology and the National Audubon Society.
The BFS has been designated as an eBird “Hotspot”, and you can go directly to the Bernard Field Station Hotspot page, which shows the full species list of species reported at the BFS.
You can explore the data in a number of ways:
See photos, audio files, and comments.
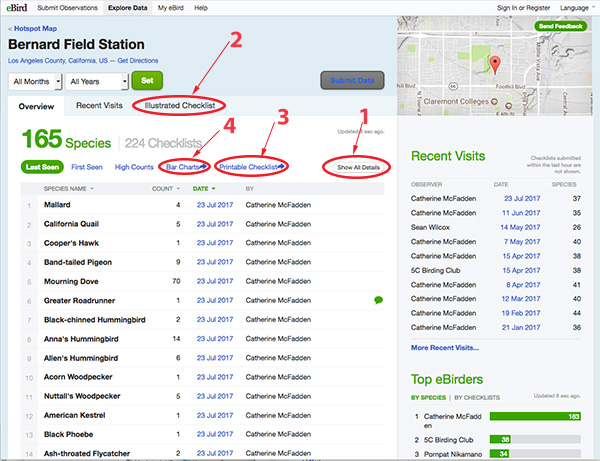
Click the “Show All Details” button (1) to see associated images, audio files, and comments (indicated by green icons on the right side of the list).View an illustrated checklist.
Click on “Illustrated Checklist” (2) to see a checklist that includes seasonal occurrence from eBird data, the most recent date a species was seen at the BFS, and the highest-rated photo from the Macaulay Library that was taken at the BFS. We don’t yet have photos of all the species, so if you have some, please consider posting them on eBird.Print a checklist.
Would you like a handy checklist to take into the field? Click on “Printable Checklist” (3) and print the resulting list. (It prints best if you select ‘landscape’ orientation.)Find out more about observers and particular visits.
Want to know who’s been birding at the BFS? Lists on the right of the page show recent visits and the top eBirders for the BFS. Want to know what species were seen on a recent visit? Check the date in the “species” or “Recent Visits” lists to see what was reported on that date.View all records summarized as a histogram of sightings by season.
Click on “Bar Charts” button (4) to see the percentage of checklists reporting a species in a given approximately one-week intervals throughout the year:
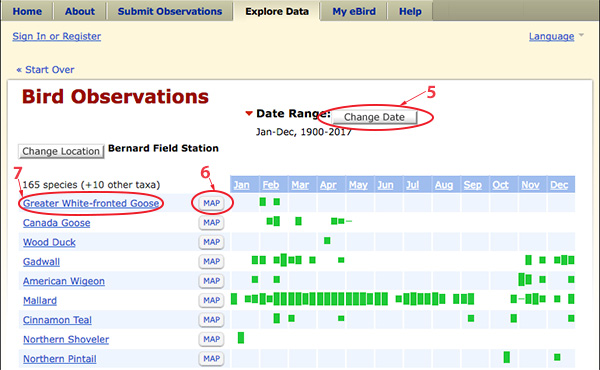
By default, reports for all seasons and all years are included in the histograms. To view frequencies for a more limited time range, click “Change Date” button (5) and select the seasons or date range you wish to view. Viewing the histograms is the most informative way to visualize the seasonal occurrence of species at BFS, but does not reflect differences in numbers of individuals present (abundance). See “Understanding the eBird Bar Charts” for more information.See detailed information for a particular species.
On the Bar Charts page, you can click the “Map” button next to a species name (6) to see where else nearby that species as been sighted; for instance, Greater White-fronted Geese in Bonelli Park. Clicking on a location marked on the map will reveal all the checklists that reported that species. You can also click on the “Map” species name (7) to see abundance, high counts, and other data for a particular species at the BFS.
There’s lots more to see on eBird, so explore and have fun! And please consider becoming an eBird contributor.
© 2001-2017 Bernard Field Station Faculty Advisory Committee
Page last updated 24 July 2017 by Nancy Hamlett.